What can portfolio aggregation unlock?
SEI Novus℠ uses portfolio aggregation to answer questions around exposures, performance, risk, and more.
What can portfolio aggregation unlock?
Accurate portfolio aggregation requires clean and comprehensive portfolio data.
Simple portfolio questions become onerous when applied to a portfolio spanning multiple managers and asset classes. Finding answers to these questions requires a robust data architecture that can both roll up data from the portfolio company level and pull down data to group across managers.
Let’s apply a few of these simple questions to a complex portfolio, with the help of SEI Novus.
What is the portfolio’s exposure by asset class?
Answering this question is relatively easy. Most managers invest in a single asset class like European public equity or U.S. private equity. SEI Novus receives a data feed from your custodian with all of your investments and the valuation for each investment at specified points in time.
Each investor will have their own tree structure for their portfolio taxonomy. To accommodate this customization, SEI Novus supports numerous tags for a single investment. Curious what that looks like?
Let’s say that Manager O is a U.S. private credit manager. Our data team can assign several tags to this single investment:
- Asset Group = Alternatives
- Asset Class = Drawdown Investment
- Sub-Asset Class = Private Credit
- Geographic Focus = US
Continuing the hypothetical, let’s say you’re also invested in Manager E, an emerging market equities manager. Our data team can assign several tags to this single investment:
- Asset Group = Equity
- Asset Class = US Equity
- Sub-Asset Class = Emerging Markets
- Geographic Focus = Emerging Markets
Once each investment has been tagged properly, the hierarchy of the tree structure (or the order of investments) can be defined. For example, investments can be grouped by asset group, then grouped by sub-asset class.
To compute dollar exposure for each level of the "tree," our platform will sum dollar exposure for each manager within each category. If you want to calculate percent exposure, the platform will divide dollar exposure by total assets under management.
Tagging is the most critical and challenging part of this process. Once the proper tags are assigned for every investment, then it is trivial to change the number of group levels and the order of the groupings in the tree structure.
With a thorough tagging system in place, we can narrow our focus to just private equity investments, and answer questions like, “What is the make-up of our private equity portfolio?”
This is answered by applying the same logic as above, while utilizing more granular tags for each investment. Examples of these tags are US LBO, European Growth Equity, Late Stage Venture, or Early Stage Venture.
What is 1-, 3-, and 5-year performance for each asset class in my portfolio?
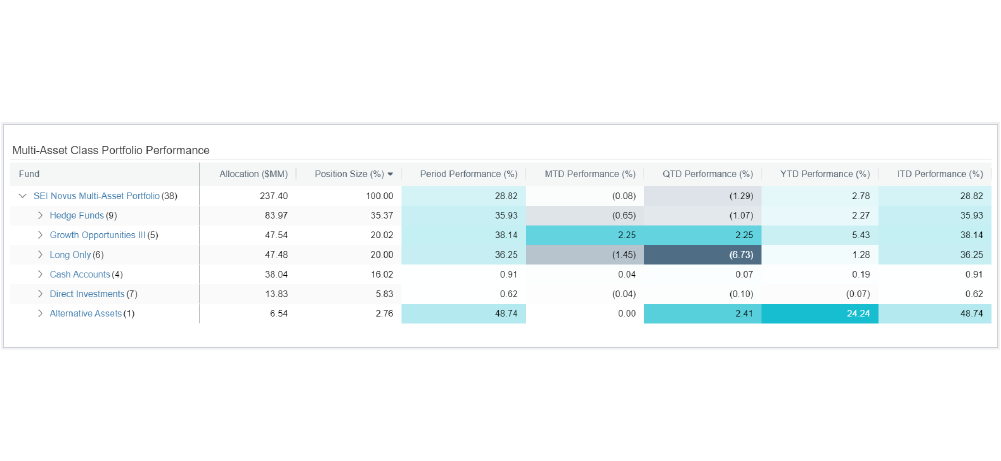
With exposures as the foundation, SEI Novus can layer on returns over specified time periods for each investment and weight those metrics by exposure. Very quickly, you can now study performance across various groupings within the defined tree structure.
Where SEI Novus really shines is when the platform disaggregates the portfolios for each manager and rolls up the disaggregated data for the individual manager portfolios—making it possible to study characteristics for the entire portfolio across all managers. That sounds complex. It is, but our flexible data architecture makes it easy for you to answer critical questions that are tedious to answer manually in Excel.
What is our exposure by sector?
For investors with hundreds of portfolio investments, this is a daunting question that can make operations teams cringe. How do we tackle this inside of SEI Novus?
We structure, organize, and harmonize all of your manager data. This can vary based on the fund type. Here are a few examples:
- SMAs: We know the weights for each of the underlying securities in that manager’s portfolio and assign sector tags to every security.
- Hedge funds: Natural language processing (NLP) is used to structure exposure data from monthly fact sheets.
- For a long/short fund, this will typically include sector.
- For a credit fund, this may be various types of credits like asset-backed securities, structured credit, CDS, or high yield.
- Private equity funds: We apply our NLP to quarterly financial updates for each private equity fund to structure meta-data for every portfolio company—including things like valuation, sector, geography, number of employees, and revenue.
Some managers may not share portfolio detail, so we use other techniques to help us complete the mosaic. For a U.S. manager, holdings data can be applied from 13F Filings. For a dedicated health care manager, the platform can assign Health Care to the entire portfolio.
Next, we harmonize the taxonomy across managers. Some managers may tag their positions as biotechnology, pharmaceuticals, or medical devices. Some managers may use third-party vendors for their sector tags. We can instruct the platform to tag anything related to Health Care as ‘Health Care’.
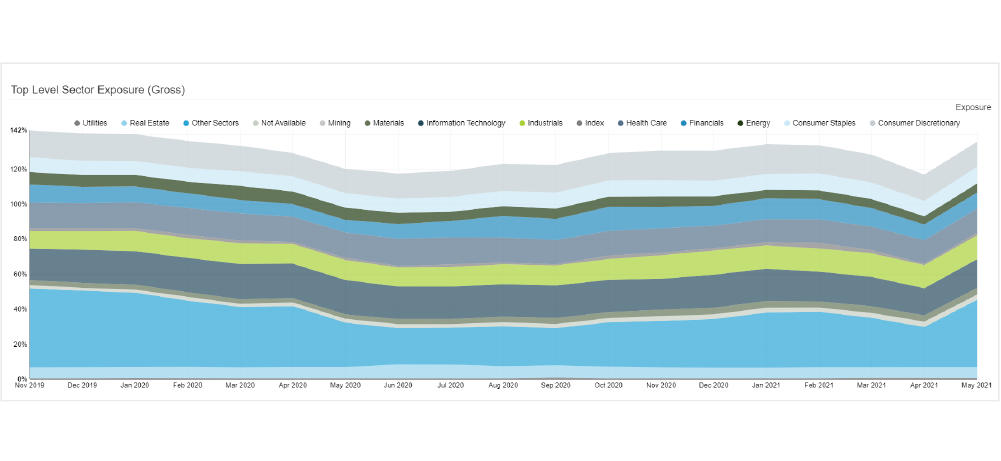
Finally, with all of this data in our robust data architecture, SEI Novus can begin to re-aggregate the data across managers, so that an investor knows exposures by sectors, fixed income classifications, commodity categories and other tags— for the entire multi-asset class, multi-manager portfolio.
How has our exposure to technology trended over the last ten years?
For comparison purposes, investors need base rates, so this question may center around identifying trends over time.
Again, this is a relatively easy thing to do in SEI Novus, but trying to do this in Excel quickly leads to a furrowed brow. We consistently do the necessary data work each and every period—daily, monthly, quarterly, and annually—so that you can study things like portfolio exposure at present in a snapshot of the current portfolio, as well as exposure trends over time.
SEI Novus can quickly produce stacked bar charts or area charts by sectors overtime or drill into one or two key sectors to review trends over the last decade. Now a CIO can start to consider the impact of a portfolio with exposure to technology that is two times its historical norm.
Multi-asset class analytics
Investors use SEI Novus to unlock deep-dive analytics for their multi-manager, multi-asset class portfolios. Through our comprehensive work constructing and maintaining your investment book of record, you can review performance, risk, and other characteristics across the entire portfolio.

Let's chat.
Interested in transforming multi-asset class investment data into meaningful insights?
Request a demoInformation provided by SEI through its affiliates and subsidiaries. This information is for educational purposes only and should not be considered investment advice. The strategies discussed herein are complex and are not suitable for all investors.
Charts included herein are for illustrative purpose only. Information provided by SEI through its affiliates and subsidiaries. This information is for educational purposes only and should not be considered investment advice. The strategies discussed herein are complex and are not suitable for all investors.
SEI Novus is not an investment advisor, broker dealer, or financial institution and does not offer or provide advice regarding analysis of securities or effecting transactions in securities. SEI Novus does not endorse or promote any mentioned investment management firm or any fund managed by any such firm. The purpose of the information herein is to demonstrate the capabilities of the SEI Novus Platform.


