
Most international allocations were built on autopilot.

November 3, 2026
9 MIN READ 9 MIN READ

The exposure gets reviewed. The construction rarely does. Here’s the question worth asking about the international sleeve you already own.

70 / 30

Systematic factor core plus fundamental specialists

+5.57% / +4.23%

Annualized excess return, SEIE and SEEM

113.7%

SEIE upside capture vs. 83.9% downside

Source: Morningstar, SEI as of 8/31/2026. Past performance does not guarantee future results.

Ask an advisor why they own a particular U.S. equity manager and you’ll usually get a considered answer — philosophy, process, where it fits, what it replaced. Ask the same question about the international sleeve and the answer is often some version of: it’s the cheap broad one, and it’s been there a while.

That’s not carelessness. U.S. large-cap growth did the heavy lifting for a decade, and international was the line item you explained away at review meetings. But it’s still a meaningful share of the equity budget — and the decision buried inside it deserves a fresh look.

The default is a cap-weighted index. That’s a choice, not a neutral position.

Owning the broad index abroad commits you to two things, whether or not you’ve decided them. You accept whatever concentration the market hands you — emerging markets indices in particular are heavily concentrated at the top. And you own the entire distribution indiscriminately, regardless of quality, valuation or trend.

Start with what has actually been rewarded

Before deciding who should manage the sleeve, ask what has driven excess return in these markets. Value, momentum and quality are the most durable answer. The open question for an international allocation is whether that evidence holds outside the U.S., where most factor research is built. 

It does. Over more than a decade in both developed international and emerging markets, value, momentum and quality have each generated positive cumulative excess returns. Growth, notably, has typically lagged behind the other factors.

The factors don’t behave identically across the two markets, and that’s the point. They’ve historically shown differentiated return patterns and low correlations to one another, which is why incorporating them together is structurally different from using one in isolation — and why we believe a systematic process that harvests all three is the right engine for the bulk of the portfolio.

Where stock picking still earns its keep

What a rules-based process can’t do is form a view — the bottom-up read on a management team, a balance sheet, a governance structure, and whether a business model actually holds up.

The instinct at that point is to reach for an active manager. And if your reference point is U.S. large cap, that instinct has been punished for years — which is why so many advisors have quietly written off fundamental research altogether. But that conclusion doesn’t travel.

Two-thirds of U.S. large-cap managers lagged the S&P 500 in the first half of 2026 — in a period S&P itself called unusually favorable for stock pickers, with dispersion at its highest since 2008. The conditions were there. Most managers still couldn’t convert them.

Cross the border and the picture changes. The majority of international, emerging markets and international small-cap managers beat their benchmarks. Only 38% of EM managers underperformed; only 35% in international small-cap.

Same managers. Same discipline. Different hunting ground — and the results invert.

Coverage thins outside the U.S., dispersion widens, and governance and management quality vary enormously between otherwise similar companies. That’s where doing the work on an individual business still tells you something the market hasn’t priced.

Where this sits in a portfolio

Before construction, role. This isn’t a satellite or a tactical trade. It’s built to occupy the same seat your core international exposure occupies today. SEIE (developed international) and SEEM (emerging markets) apply the identical structure in their respective markets.

Frontify Image
SEIE_SEEM_inline-graphic-test-v2


For illustrative purposes only. SEIE and SEEM apply the same 70/30 structure and comparable active risk within developed international and emerging markets respectively.

The decision rule

If the international sleeve is passive by default and you’ve never explicitly underwritten that choice — this is the conversation.

The repeatable line

Factor discipline as the engine. Fundamental judgment layered on top, sized for the odds.
One philosophy. Two markets.

A 70% systematic factor core from SEI’s Quantitative Investment Management team — 10 years of live factor portfolios — paired with 30% allocated to fundamental specialists, each selected for a distinct and complementary source of return.

Systematic factor core + fundamental specialists

SEIE-blog-pie-chart

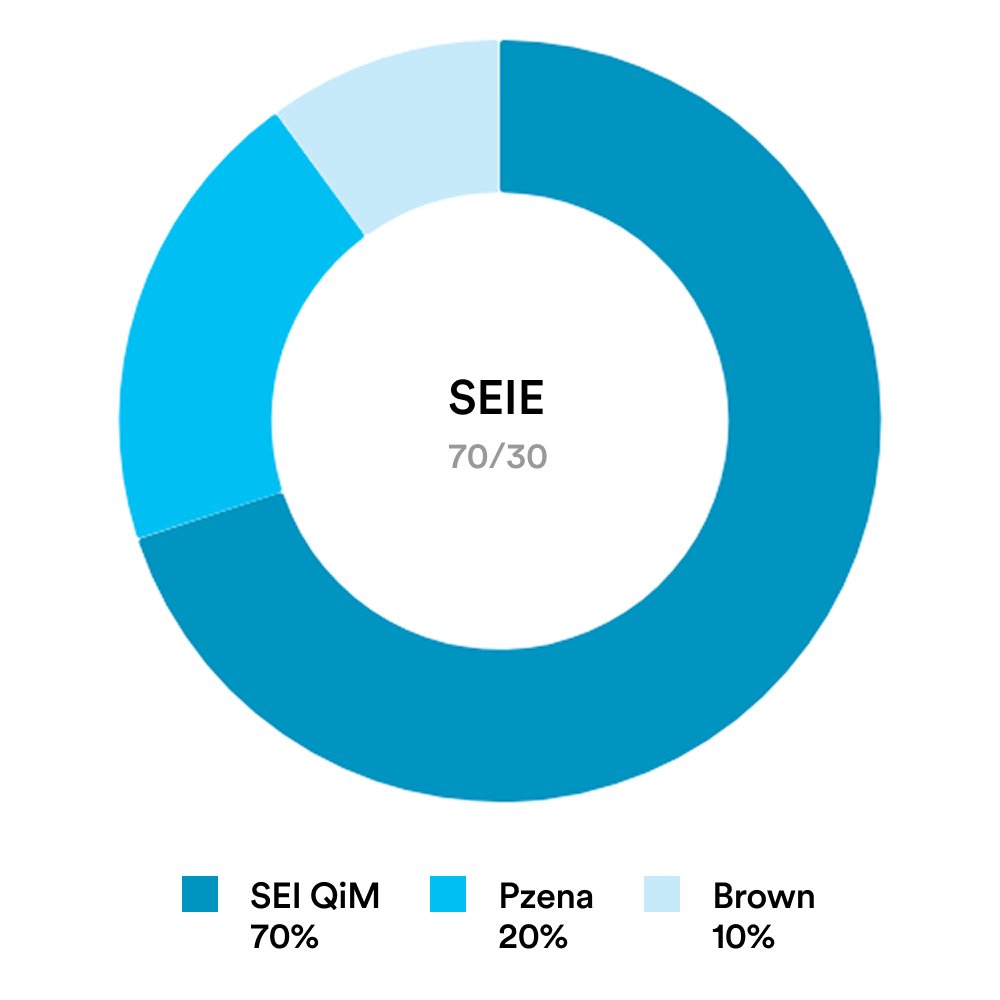
SEIE

Developed International · Benchmark: MSCI EAFE

  • SEI QiM (70%) — multi-factor process seeking value, momentum and quality across developed international markets
  • Pzena (20%) — deep value; companies at meaningful discounts to normalized earnings power
  • Brown Advisory (10%) — quality; durable businesses, strong cash-flow generation, capable management
SEEM-blog-pie-chart

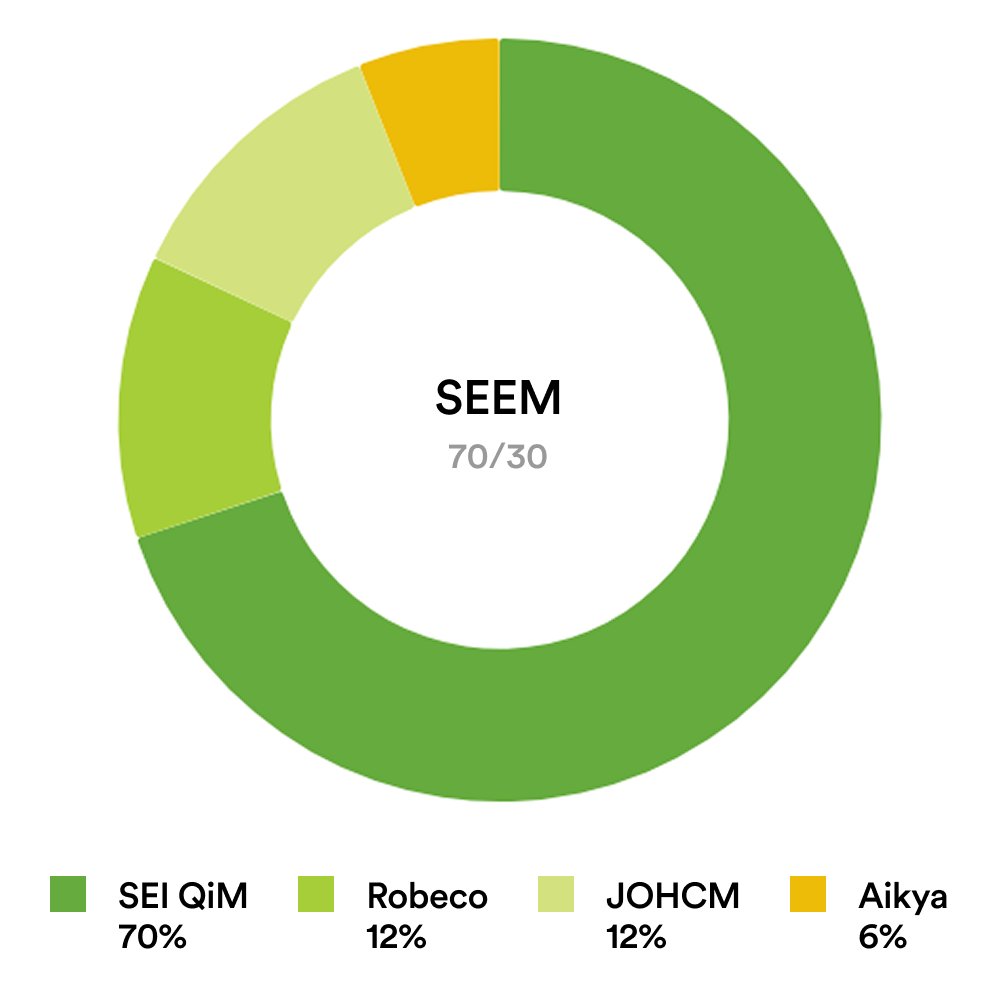
SEEM

Emerging Markets · Benchmark: MSCI EM

  • SEI QiM (70%) — multi-factor process seeking value, momentum and quality across emerging markets
  • Robeco (12%) — value; fundamental research plus country and quantitative insights
  • JOHCM (12%) — momentum; sustainable earnings, revisions and price trends
  • Aikya (6%) — quality; resilient business models, stewardship, downside management

Why these managers, and why this size

The specialists aren’t chosen to be factor-neutral — they’re chosen to express the same three factors through fundamental research. A manager’s own definition of a “value stock” and a systematic value signal are complementary, and holding both makes the portfolio more likely to capture the underlying premium. The 30% sizing is what lets us hire genuinely high-conviction managers: concentrated enough to add real insight, sized so that conviction shows up as return rather than as active risk the portfolio can’t carry.

What the structure has produced

1. These portfolios look nothing like the index

Scoring companies on value, momentum and quality produces a portfolio the benchmark wouldn’t. Value and momentum names cluster in mid- and smaller-cap companies, where the market pays less attention; quality tends to sit in larger caps. The resulting size profile is a byproduct of harvesting the premia, not a deliberate size call — as of 8/31/2026 SEIE carries 44.4% in the smallest quintile versus 19.7% for EAFE, and SEEM carries 29.5% versus 20.1% for EM.

2. The capture profile is asymmetric in both sleeves

More participation on the way up than on the way down, in developed and emerging markets alike. SEIE captured 113.7% of the upside against 83.9% of the downside; SEEM 105.7% against 89.2%. Both did it at beta of essentially 1.0, so the asymmetry isn’t a byproduct of simply taking less market risk.

3. What it added up to

MetricSEIEMSCI EAFE SEEMMSCI EM
Annualized return28.71%23.14% 33.86%29.64%
Std. deviation12.53%12.25% 18.84%18.94%
Sharpe ratio1.951.54 1.571.34
Beta1.001.00 0.991.00
Up capture113.77%100% 105.7%100%
Down capture83.9%100% 89.2%100%

Excess return of +5.57% annualized for SEIE and +4.23% for SEEM, net of fund expenses, with higher Sharpe ratios than both benchmarks — while holding standard deviation and beta in line with the index.

For SEIE standard performance and most recent monthly performance please click here. 

For SEEM standard performance and most recent monthly performance please click here. 

The performance data quoted represents past performance. Past performance does not guarantee future results. The investment return and principal value of an investment will fluctuate so that an investor's shares, when redeemed, may be worth more or less than their original cost, and current performance may be lower or higher than the performance quoted. For performance data current to the most recent month end, please click links above.

The question to take back to the portfolio

When did I last underwrite the construction of my international sleeve — as opposed to inheriting it?

The takeaway

Historically rewarded factors travel. They’ve driven excess return in developed international and emerging markets for more than two decades, and they can be harvested systematically. And in exactly these markets — where coverage is thin and dispersion is wide — skilled fundamental managers have genuinely beaten their benchmarks. The design question was never which one to believe in. It was how to combine them.

Seventy–thirty is our answer.

Important Information

Financial terms and index definitions

SPIVA data source: S&P Dow Jones Indices LLC, CRSP, SPIVA U.S. Scorecard Mid-Year 2026, data as of June 30, 2026. Figures shown represent the percentage of actively managed U.S.-domiciled funds in each category underperforming their comparison index based on absolute return. Fund returns are net of fees, excluding loads, and results are corrected for survivorship bias, meaning every fund that existed at the start of the period is counted, including those subsequently merged or liquidated. Comparison indices: S&P 500 (All Large-Cap), S&P MidCap 400 (All Mid-Cap), S&P SmallCap 600 (All Small-Cap), S&P World (Global), S&P World Ex-U.S. (International), S&P Emerging Plus (Emerging Markets) and S&P Developed Ex-U.S. SmallCap (International Small-Cap). Short-term results reflect a single six-month period and may not be indicative of longer-term outcomes; over longer horizons the majority of active managers underperformed in every category shown. SPIVA is a registered trademark of S&P Global. SEI is not affiliated with S&P Dow Jones Indices. The fund categories referenced are not directly comparable to SEIE or SEEM, which are actively managed ETFs benchmarked to MSCI indices.

There are risks involved with investing including loss of principal. The risks of owning shares of an ETF generally reflect the risks of owning the underlying securities or other instruments the ETF is designed to track, although lack of liquidity in an ETF could result in its value being more volatile than the underlying portfolio securities. There is no guarantee an investment objective will be achieved, nor that risk can be managed. A company may reduce or eliminate its dividend, causing losses to a fund. In addition to the normal risks of investing, there can be no assurance that performance will be enhanced or risk will be reduced for investment strategies that seek to provide exposure to certain quantitative factors. Exposure to such investment factors may detract from performance in certain market environments, in some cases for extended periods. While the investment strategies are actively managed, the strategies’ investment process is expected to be heavily dependent on quantitative models, and the models may not perform as intended.

International investments may involve risk of capital loss from unfavorable fluctuation in currency values, from differences in generally accepted accounting principles, or from economic or political instability in other nations. Emerging markets involve heightened risks related to the same factors, as well as increased volatility and lower trading volume. Investments in smaller companies typically exhibit higher volatility.

While the investment strategies are actively managed, the strategies’ investment process is expected to be heavily dependent on quantitative models and the models may not perform as intended.

The Funds may trade securities actively, which could increase transaction costs and could increase the amount of taxes owed by generating short-term gains, which may be taxed at a higher rate. Investments in smaller companies typically exhibit higher volatility.

SEI Investments Management Corporation (SIMC) is the adviser to the SEI Funds, which are distributed by SEI Investments Distribution Co. (SIDCO). SIMC and SIDCO are wholly owned subsidiaries of SEI Investments Company. For those SEI Funds which employ the 'manager of mangers' structure, SEI Investments Management Corporation has ultimate responsibility for the investment performance of the Fund due to its responsibility to oversee the sub‐advisers and recommend their hiring, termination, and replacement.

To determine if the Funds are an appropriate investment, carefully consider the investment objectives, risk factors, and charges and expenses before investing. This and other information can be found in the fund’s prospectus, and if available, the summary prospectus, which can be obtained by calling 1-800-DIAL-SEI. Please read the prospectus carefully before investing.