

August 2026 QiM Fact(or) Sheet

Market: US equities initially rallied as expectations for rate hikes fell before Iran tensions and elevated oil prices brought inflation and rate concerns back into focus.
Macro: Labour and consumer data softened, and inflation eased at the margin, while business activity remained firm. The conflicting signals left investors debating whether the Fed could afford to ease.
Earnings: 86% of S&P500 companies beat EPS expectations, with CY2026 earnings growth estimates rising to 31.4%
Countries: Korea and Taiwan led on semiconductor bounce. Canada benefited from Financials and commodities, while France lagged as fiscal and political uncertainty increased.
Sectors: Technology bounced from the last month’s momentum trade deleveraging. Materials benefited from the preciousmetals rally, while Energy gained from both higher oil prices and strong earnings.
Factors: There was no clear factor leadership in Developed Markets apart from rising risk appetite weighing on Low Volatility. In Emerging Markets, the semiconductors bounce helped Momentum, reflecting the enormous weight of semiconductor stocks in the index.
Factor families
Exhibit 1: August 2026 QiM Investable factor proxies versus respective capitalization weighted indexes
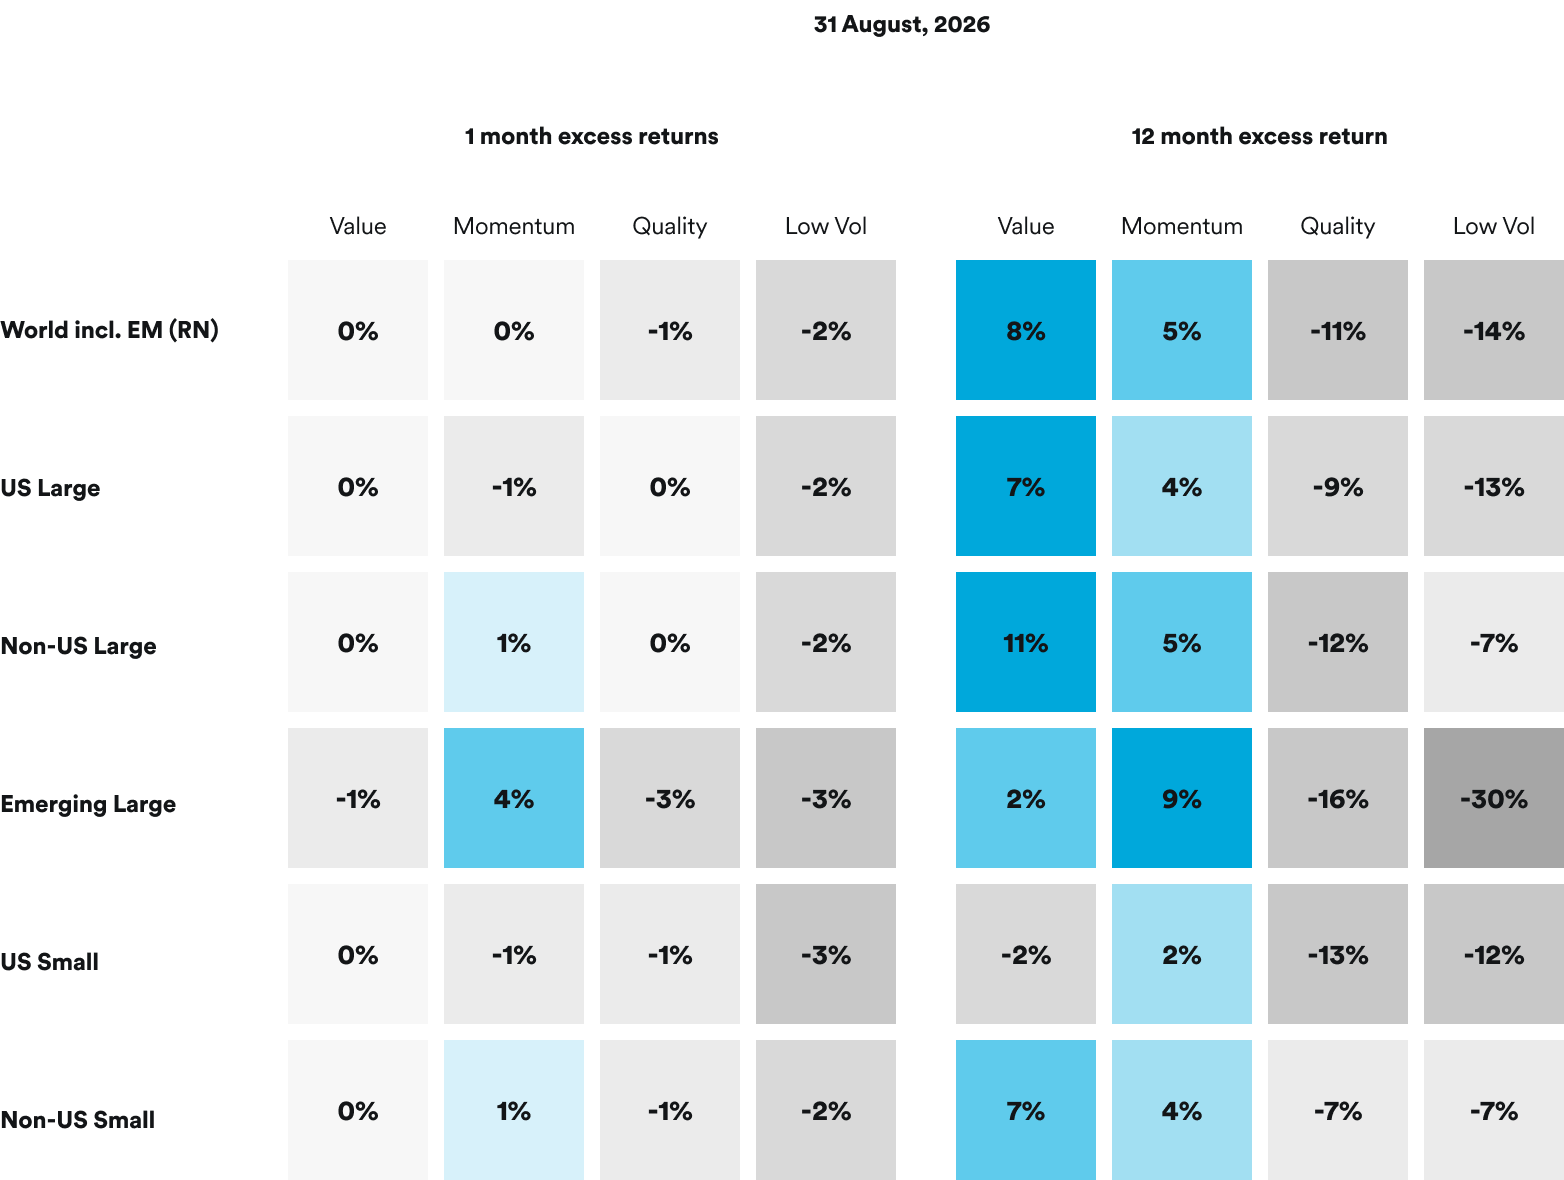
Source: SEI, based on data from MSCI, Axioma and FactSet. Data as of August 31, 2026. Returns quoted in USD. Metrics are composites of underlying ratios that SEI has determined to be appropriate measures of each factor. Data refers to past performance of top-tercile factor-proxy portfolios vs. the capitalisation-weighted benchmark and rebalanced quarterly. Returns are for illustrative purposes only and do not represent actual fund performance. Excess returns measured against (in descending order): MSCI ACWI Large Cap, MSCI USA Large Cap, MSCI EAFE Large Cap, MSCI EM Large Cap, MSCI USA Small Cap, MSCI EAFE Small Cap Indexes. Index performance returns do not reflect any management fees, transaction costs or expenses. Indexes are unmanaged and one cannot invest directly in an index. Past performance is no guarantee of future results.
Adaptive Outlook
Summary: Maintaining Value overweight.
- Trend: Value's outperformance trend is intact, though its pace continues to ease. Quality is picking up modestly.
- Valuation: Quality remains the cheapest family on relative valuation and Momentum the most expensive.
- Macro: Rate expectations moved further in Value's favour and away from Momentum. Economic activity indicators were flat.
Exhibit 2: August 2026 adaptive factor family positioning
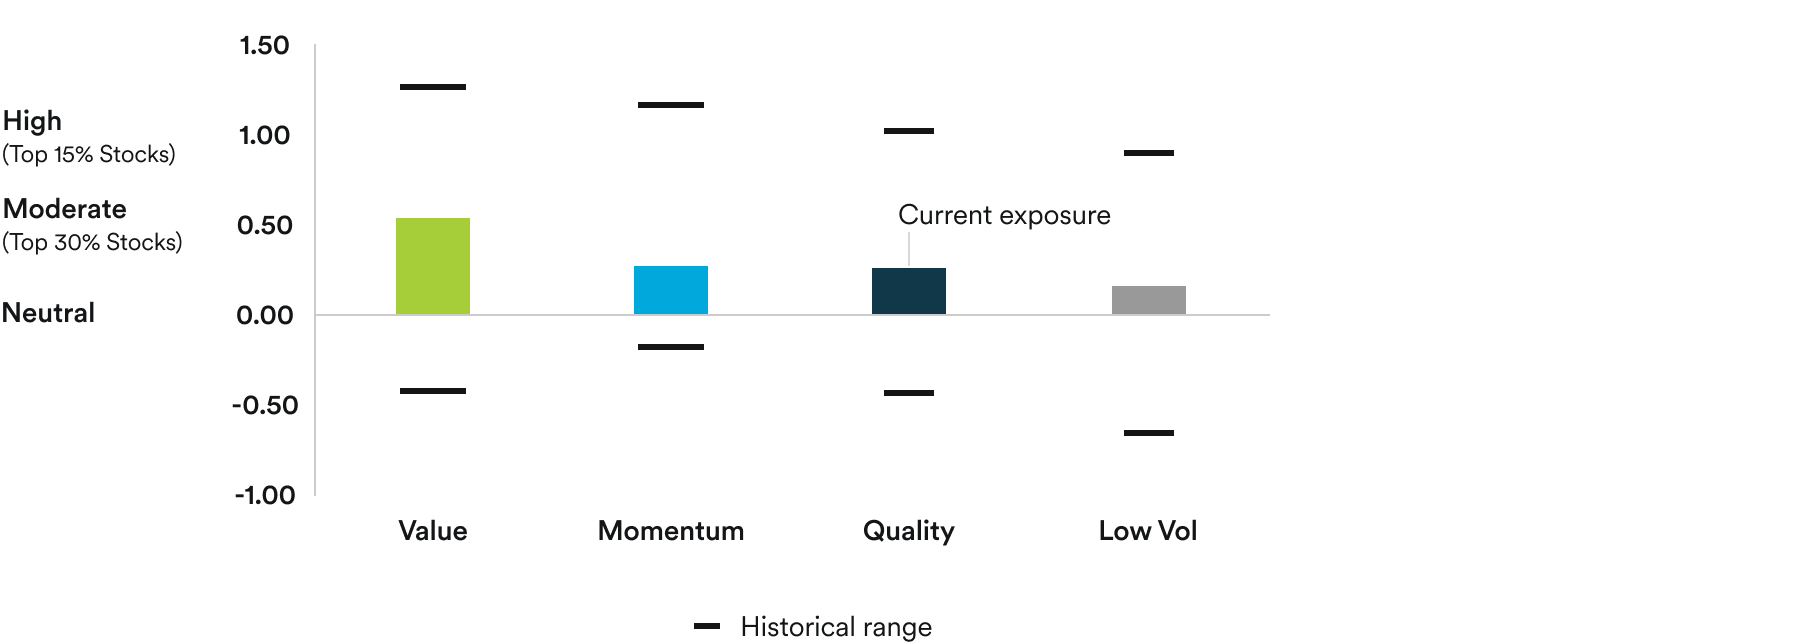
Source: SEI, the axis displays z-score exposure versus benchmark, as of August 31, 2026. Long term average exposure from January 31, 2003, to current. Benchmark: MSCI World Index.
Z-scores tell us how exposed a portfolio is to a factor, compared to a benchmark, based on what's normal for that factor. It is a common "currency" of portfolio exposures, making unrelated raw metrics like P/E or ROE comparable to each other. A value of zero means the portfolio is neutral to the benchmark for that factor. Higher values mean the portfolio has more exposure to that factor than the benchmark.
Economic indicators
US.: Inflation eases as labour and consumer conditions soften
Jobs: Labour market softens as hiring weakens
- Nonfarm Payrolls: at -23.0K, below expectations and prior month. (20K R)
- Unemployment Rate: 4.1%, marginally below expectations and prior month (4.2%).
- Initial Jobless Claims: 205.5K monthly average, marginally above prior month average of 203.25K.
Inflation – Underlying price pressures ease but remain elevated
- Core CPI: 2.5 (YoY), in line with expectations and below prior month. (2.6%)
- Core PCE Deflator: 3.3% (YoY), above expectations and in line with prior month. (3.3%)
- Hourly Earnings (preliminary): 3.2% (YoY), below expectations and prior month. (3.4% R)
Consumer – Spending moderates while confidence remains subdued
- Retail Sales: -0.60% (MoM, SA), below expectations and prior month. (0.25%)
- Michigan Sentiment (preliminary): 51.0, below expectations and prior month. (55.2)
- Consumer Confidence: 89.4, marginally below expectations and prior month. (90.2)
Manufacturing and Services – Business activity remains expansionary
- S&P PMI Manufacturing, SA (preliminary): 53.2, below expectations and marginally below prior month. (53.9)
- S&P PMI Services, SA (preliminary): 56.8, above expectations and prior month. (54.6)
- Empire State Index, SA: 20.6, above expectations and prior month. (15.6)
Source: FactSet. Past performance is not a reliable indicator of future results.
The rest of the world
China: Export growth remains strong as domestic activity softens
- Exports: 23.9% (YoY), above expectations and below prior month. (27.0%)
- S&P PMI manufacturing: 50.9, below expectations and prior month. (51.7)
- S&P PMI services: 50.4, below expectations and prior month. (54.1)
- CPI: 0.5% (YoY), below expectations and prior month. (1.0%)
Japan: Manufacturing strengthens as services activity improves
- CPI Core National: 1.8% (YoY), above prior month. (1.6)
- S&P Manufacturing PMI (preliminary): 55.1, above prior month. (54.5)
- S&P Services PMI: 52.3, marginally above prior month. (51.2)
Germany: Inflation rises while manufacturing strengthens
- CPI: 2.8% (YoY), above prior month. (2.3%)
- S&P Manufacturing PMI (preliminary): 54.1, above expectations and prior month. (52.2)
- S&P Services PMI (preliminary): 48.5, below expectations and prior month. (49.8)
U.K.: Inflation remains elevated as services activity strengthens
- CPI Core: 2.6% (YoY), above expectations and in line with prior month.
- Services inflation eased from 3.6% to 3.4%, while goods inflation increased from 1.7% to 2.2%, indicating that underlying price pressures remained persistent.
- S&P Manufacturing PMI (preliminary): 51.5, marginally below expectations and prior month. (51.9)
- S&P Services PMI (preliminary): 52.8, above expectations and marginally above prior month. (52.1)
Source: FactSet. Past performance is not a reliable indicator of future results.
Sector and country returns
Exhibit 3: MSCI All Country World Index
Source: SEI, MSCI. As of August 31, 2026. Past performance is not a reliable indicator of future results.
Glossary and index definitions
For financial term and index definitions, please see: https://www.seic.com/ent/imu-communications-financial-glossary
Important information
This material represents an assessment of the market environment at a specific point in time and is not intended to be a forecast of future events or a guarantee of future results. Positioning and holdings are subject to change. All information as of the date indicated. There are risks involved with investing, including possible loss of principal. This information should not be relied upon by the reader as research or investment advice, (unless you have otherwise separately entered into a written agreement with SEI for the provision of investment advice) nor should it be construed as a recommendation to purchase or sell a security. The reader should consult with their financial professional for more information.
Statements that are not factual in nature, including opinions, projections and estimates, assume certain economic conditions and industry developments and constitute only current opinions that are subject to change without notice. Nothing herein is intended to be a forecast of future events, or a guarantee of future results.
Certain economic and market information contained herein has been obtained from published sources prepared by other parties, which in certain cases have not been updated through the date hereof. While such sources are believed to be reliable, neither SEI nor its affiliates assumes any responsibility for the accuracy or completeness of such information and such information has not been independently verified by SEI.
The value of an investment and any income from it can go down as well as up. Investors may get back less than the original amount invested. Returns may increase or decrease as a result of currency fluctuations. Past performance is not a reliable indicator of future results. Investment may not be suitable for everyone.
This material is not directed to any persons where (by reason of that person's nationality, residence or otherwise) the publication or availability of this material is prohibited. Persons in respect of whom such prohibitions apply must not rely on this information in any respect whatsoever.
The information contained herein is for general and educational information purposes only and is not intended to constitute legal, tax, accounting, securities, research or investment advice regarding the strategies or any security in particular, nor an opinion regarding the appropriateness of any investment. This information should not be construed as a recommendation to purchase or sell a security, derivative or futures contract. You should not act or rely on the information contained herein without obtaining specific legal, tax, accounting and investment advice from an investment professional.
The views contained herein are not to be taken as advice or a recommendation to buy or sell any investment in any jurisdiction. Our outlook contains forward-looking statements that are judgments based upon our current assumptions, beliefs and expectations. If any of the factors underlying our current assumptions, beliefs or expectations change, our statements as to potential future events or outcomes may be incorrect. We undertake no obligation to update our forward-looking statements.
In the UK and the EEA this information issued in the UK by SEI Investments (Europe) Ltd, 1st Floor, Alphabeta, 14-18 Finsbury Square, London EC2A 1BR which is authorised and regulated by the Financial Conduct Authority. Investments in SEI Funds are generally medium- to long-term investments.
This information is made available in the Middle East and Australia FOR PROFESSIONAL (non-retail) USE ONLY by SIEL.
Any questions you may have in relation to its contents should solely be directed to your Distributor. If you do not know who your Distributor is, then you cannot rely on any part of this document in any respect whatsoever.
Issued in South Africa by SEI Investments (South Africa) (Pty) Limited FSP No. 13186 which is a financial services provider authorised and regulated by the Financial Sector Conduct Authority (FSCA). Registered office: 3 Melrose Boulevard, 1st Floor, Melrose Arch 2196, Johannesburg, South Africa.
QiM is a specialist quantitative investment management team within SEI’s Investment Management Corporation (SIMC). The team is responsible for the research, development, and management of quantitative investment portfolios. QiM employs a disciplined, active investment process that targets companies demonstrating robust fundamentals and positive performance trends, with a particular emphasis on value, quality, and momentum factors. The team operates from offices in London, UK, and Oaks, PA, USA.
This content is restricted. Please confirm you are a qualified professional investor.