Increase members' retirement spending power
Learn how our customised glide paths can potentially increase members' savings in retirement.
Increase members' retirement spending power
What are your top retirement risks?
It’s easy to assume that investments are the biggest retirement risk to plan around, but not preparing for a longer life expectancy is just as risky. For a 65-year-old man, the probability of dying at age 68 or before is 5%1, the same probability as living to 96 or beyond. Even though the average life expectancy for men is 84, only 4.4% of them die at that age1. While many focus on the volatility of their investments, the biggest risk is your time horizon, also known as longevity risk.
In the past, pensioners would guard against longevity risk by investing in an annuity that paid their pension in annual increments until death, whether that was 10, 20, or 30 years after retiring. Given current low interest rates, putting £100,000 into an annuity, for example, would pay out only £4,600 per year2 during your retirement. You could have a better outcome by stashing £100,000 under your mattress and taking out £5,000 every year until your death 20 years later—and in this case you’ll pay no fees!
Though annuities do guard against longevity risk, this example shows the current value that they offer. Partly to mitigate this problem, the government created pensions freedoms, allowing pensioners to draw down any amount of money in their pension each year. We believe that SEI can deliver better outcomes over the long term if pensioners keep investing their savings through retirement.
How long do members' savings have to last?
If you’re not buying an annuity, you must consider the risk that your life will outrun your retirement savings. Current longevity stats show that, most of the time, a couple will at least live to age 801. After that, the death rate increases steadily and less than 10% of couples have a survivor older than 96. Since there’s no way to accurately predict your length of life past 80, it is prudent to have a time horizon of 30-35 years past retirement to ensure your savings last.
What a member needs to retire comfortably
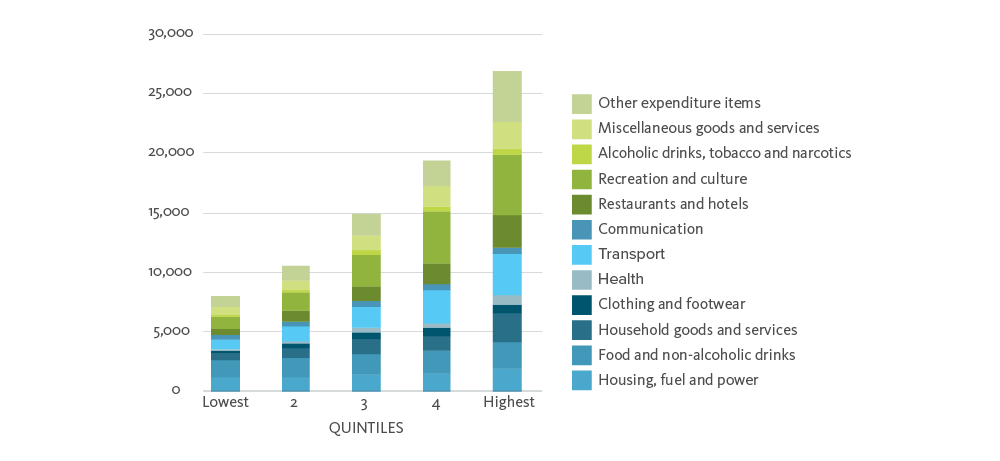
To quantify a comfortable retirement, we looked at what current pensioners are spending. The state pension gives roughly £9,300 per year3, which drives the minimum spend in retirement. Research from the Pensions and Lifetime Savings Association on the retirement living standards4, however, shows that pensioners need at least £10,200 per year to meet a minimum standard of living and £20,200 per year to meet a moderate standard of living. As shown below, about 20% of pensioners can’t cover the expenditure for the minimum standard and 80% can’t cover the moderate standard.
FIGURE 1: Annual UK expenditure per pensioner (£ pa)
Source: Data from Office of National Statistics. UK expenditure per person (£ pa) of two adult retired households by gross income quintile group financial year ending 2018 to financial year ending 2020.
The average expenditure is £14,900 per year. At this level, spending on Recreation & Culture increases. Those that can afford to spend above the average can have a much more comfortable retirement with more money allocated to leisure activities. This goal is both achievable and desirable for defined contribution pension savers with a 20-year time horizon. By comparing essential vs non-essential spending, in Figure 2 we see that pensioners spend quite a bit on recreation, but they spend the most during the early years of retirement. Once mobility decreases (particularly at the age of 70-75), there is a sharp decline in overall spending.
FIGURE 2: Expenditure on goods and services by age
Source: Understanding retirement journeys: Expectations vs reality by Cesira Urzi Brancati, Brian Beach, Ben Franklin and Matthew Jones. Updated for 2021 prices.
Customising the DC glide path to enhance retirement outcomes in all market conditions
The following example demonstrates how we implement the latest longevity needs and spending statistics in a glide path. Consider a typical scheme member, in this case a 45-year-old male, with an average salary and low savings (though he might have savings elsewhere). We focus on the changes we can make to his investment glide path, which would rely on return-generating equities for the time period to retirement. This member’s original default glide path had allocations to passive equities and bond-heavy multi-asset funds. Because over the long term, bonds have a high risk of underperforming equities5, we treat bonds as shorter-term investments and only begin to invest in them once a pensioner turns 50, in preparation to have a drawdown option at 65. We also expect to improve outcomes in this period by using factor investing to enhance equity returns, focusing on those areas of the market that are supported by robust academic evidence to persist over time.
As savers age, investments can then be de-risked to growth-oriented, multi-asset strategies, which have a lower allocation to low-yielding bonds. As members get closer to drawing down their savings, the pattern of retirement spending that declines with age can be matched with bond investments. Bonds are more stable than equities over short-term horizons and can bring more certainty to meeting pensioners’ spending needs.
Retirees at age 65 still have long-term time horizons. It is important to have enough assets in return-generating investments to fund a retirement of 30-35 years.
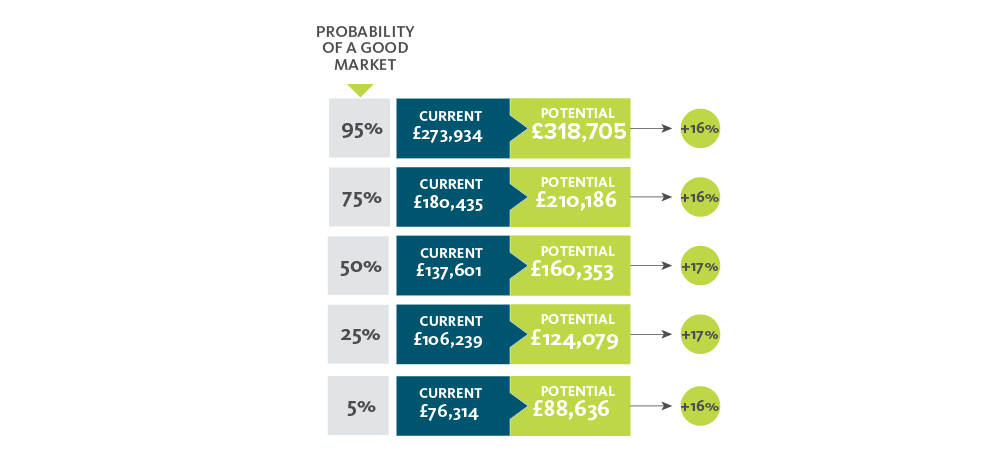
We perform simulations to understand how member outcomes would change in different market environments. Our goal is to ensure that even in good, bad, or indifferent markets, members’ retirement outcomes are enhanced.
FIGURE 3: Results of our pension simulation
Source: SEI. Expected risk and return projections using SEI Capital Market Assumptions. Asset class assumptions are set using a combination of empirical and forward-looking analysis and are designed to be long-term in nature. Assumptions include estimates of annual return, volatility and correlations by asset class, as well as prospective ranges for these values over various time horizons. As at 31 March 2021.
We use our investment knowledge and technology to design a glide path that helps to increase spending power in retirement. In the example described, we expect to increase member savings by 16-17% in retirement even in unpredictable market conditions. As a result, spending power is increased.
1) "2017-2019 National life tables: UK", Office for National Statistics. ons.gov.uk
2) "Fidelity International’s Retirement Services Annuity Quotation Portal as at June 2021", Fidelity, fidelity.retirementportal.co.uk. Most competitive annuity shown for level, single life annuity with no guarantee period.
3) "The new State Pension", Age UK, ageuk.org.uk.
4) "Picture your Future, Retirement Living Standards", Pensions and Lifetime Savings Association, retirementlivingstandards.org.uk
5) "Barclays Equity Gilt Study, 2018," SEI, seic.com.
Contact us if you would like to examine the projected retirement outcomes for your DC scheme’s members and find out how SEI can enhance outcomes
Important information
This is a Marketing Communication. This webpage has been created in relation to the SEI Master Trust, an occupational pension scheme which is authorised by the Pensions Regulator. The trustee of the SEI Master Trust is SEI Trustees Limited. SEI Trustees Limited has appointed SEI Investments (Europe) Ltd (“SIEL”) as investment adviser to the SEI Master Trust and pursuant to its investment advisory agreement. This information is issued and approved by SEI Investments (Europe) Ltd (“SIEL”) 1st Floor, Alphabeta, 14-18 Finsbury Square, London EC2A 1BR. This advert and its contents are directed at persons who have been categorised by SIEL as a Professional Client and is not for further distribution. SIEL is authorised and regulated by the Financial Conduct Authority. While considerable care has been taken to ensure the information contained within this webpage is accurate and up-to-date and complies with relevant legislation and regulations, no warranty is given and no representation is made as to the accuracy or completeness of any information and no liability is accepted for any errors or omissions in such information or any action taken on the basis of this information. The information in this webpage is for general information purposes only and does not constitute investment advice. You should read all the investment information and details on the funds before making investment choices. Please refer to our latest Prospectus (which includes information in relation to the use of derivatives and the risks associated with the use of derivative instruments), Key Investor Information Document, Summary of UCITS Shareholder rights (which includes a summary of the rights that shareholders of our funds have) and the latest Annual or Semi-Annual Reports for more information on our funds, which can be located at Fund Documents (https://seic.com/en-gb/fund-documents). And you should read the terms and conditions contained in the Prospectus (including the risk factors) before making any investment decision. If you are in any doubt about whether or how to invest, you should seek independent advice before making any decisions. The UCITS may be de-registered for sale in an EEA jurisdiction in accordance with the provisions of the UCITS Directive. Past Performance does not predict future returns. Investment in the range of the SEI Master Trust’s funds are intended as a long-term investment. The value of an investment and any income from it can go down as well as up. Investors may not get back the original amount invested. This document and its contents are for Institutional Investors only and not for further distribution.
SEI’s Capital Market Assumptions
The projections presented within this document are provided for illustrative purposes only. These figures are based on SEI’s Capital Market Assumptions (CMA). Asset class assumptions are set using a combination of empirical and forward looking analysis and are designed to be long term in nature. Assumptions include estimates of annual return, volatility and correlations by asset class, as well as prospective ranges for these values over various time horizons. Changes in assumptions may have a material impact on the simulated performance presented. Past performance is not a reliable indicator of future results. All projected returns are presented gross of all fees and charges, which will have the effect of reducing the illustrated performance. The CMAs are revisited regularly on a minimum basis to reflect the changes in the market environment. The forecasts shown on those pages are not indicative of the future or likely performance of the portfolios, especially over a short term time period. CMAs are not predictions of how asset classes will perform or reliable indicators of future results. The data includes or has been based on anticipated future performance determined using various assumptions. Such forecasts are not a reliable indicator of future results.


